
Are you little lost and need some helpful guide in using the OKL chart? Perfect, you’re in the right spot!
In this guide, you’ll learn about:
- What is the OKL Chart?
- How should you read the OKL Chart?
- What should your Macros look like with an OKL Chart?
The Optimal Ketogenic Living or OKL Chart, is a free, evidence based chart first created in 2015 by Raymund Edwards for his Facebook keto diet support group namesake.
The chart was created to support the group which aims to live optimally through application of the research performed by such names as; Jeff Volek and Dr. Stephen Finney, experts in the field of ketogenic dieting
What is the OKL Chart?
Optimal keto living is difficult for many first-time keto dieters and the confusion associated with setting up the diet derails many forays into the world of ketosis experimentation.
It can be extremely confusing to work out how much of, and how little of, you should be eating of certain macronutrients.
While there are online and mobile keto calculators, they do tend to be inaccurate and misguided when compared to an optimal keto living chart.
Of note, both dietary tools base their recommendations on changing macronutrient ratios. Macronutrients are the three core nutrients of our diet; dietary fat, protein and carbohydrate. So, how can one be more useful than the other?
The online and mobile calculators will base intake ratios of macronutrients on percentages; a great idea in principle but not always applicable depending on the person.
It could leave certain people with inadequate amounts of certain nutrients and over consumption of others (namely carbohydrate, which would kick the person straight out of ketosis).
Read Also: The Best 7-Keto-DHEA-Metabolite
Most of these calculators tend to give numbers based on weight loss goals too, which may not be the aim of every individual following a ketogenic diet (athletes for example).
The OKL designed by Mr Edwards however doesn’t simply provide you with percentages but the exact macronutrient amounts you need to be eating to achieve a state of optimal keto living irrespective of your body size and gender.
It removes the element of human error by providing the exact amount of fats, carbohydrates and protein for a person based on their anthropometric measurements.
It provides a range of nutrients so that those who are dieting for weight loss, management or gain all have an idea of what exactly they should be taking in each day to progress towards these goals.
Read Also: What Are The Best Keto Fiber Supplements for Optimal Health?
How to read the OKL Chart
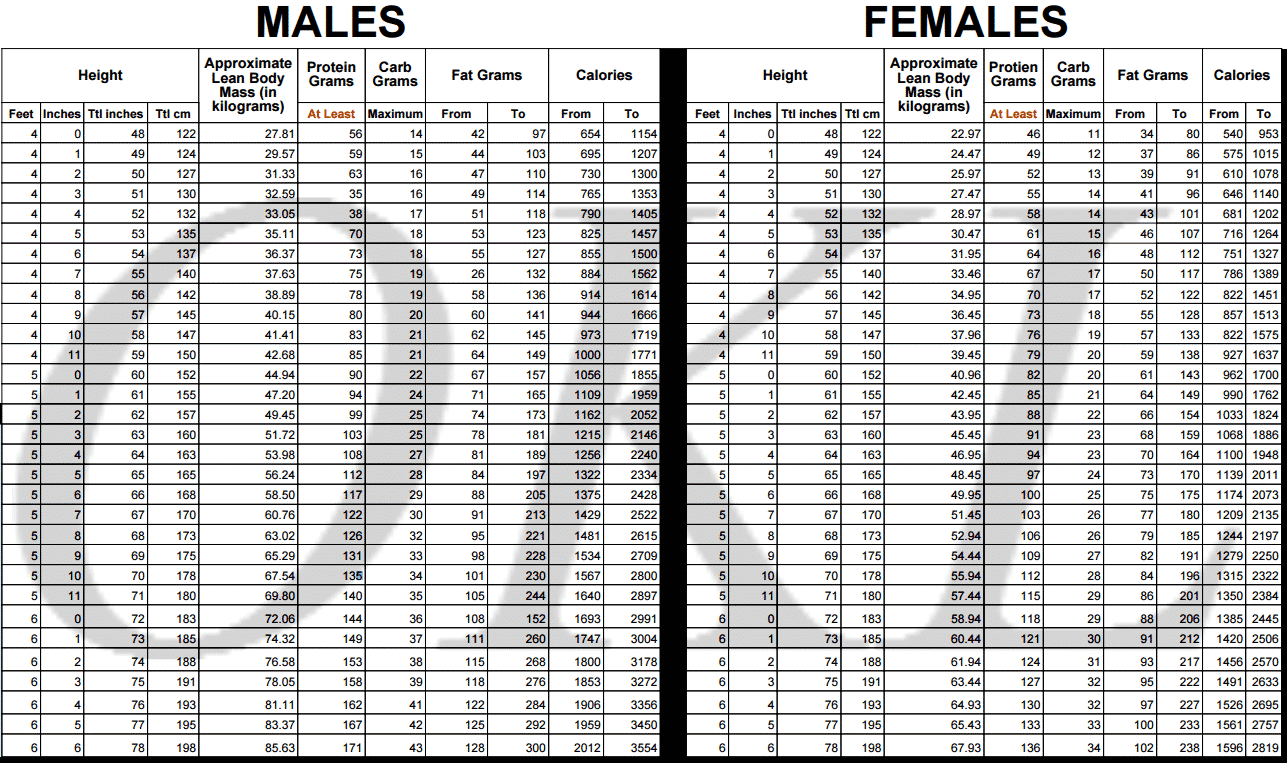
The chart itself is split into two sections; recommendations for males and recommendations for females. Two differently sized bodies with different physiologies, each requiring their own specific considerations for dietary strategies.
Before identifying your recommended nutrient intakes from the chart you’ll need to have your height and a rough estimate of bodyfat percentage.
Once you have this, simply scan down the left-hand side of the chart until you find the profile which best fits you. This’ll give you the numbers you should aim to achieve each day for dietary fats, carbohydrate and protein.
Read Also: How to Do Intermittent Fasting as a Beginner?
What should your macros look like when using the OKL chart?
OKL and Protein Recommendations
The number given for protein intake is a rough estimate of the “bare minimum” you should be achieving. This is important as achieving this number should prevent any of the nasty effects of inadequate protein intake (such as lean muscle mass loss).
Dietary protein is an incredibly valuable tool in the quest for optimal keto living; not only can it be a great aid for weight loss, but it can also lead to improved body composition, accelerated recovery after exercise and improved satiety.
For those who are exercising more frequently, there will be added protein intake demand. Studies have suggested anywhere between 1.4 to 2.0g / kg of body mass a day as an adequate amount to aim for, for more athletic populations.
Read Also: What Are Some Tasty Keto Fat Bombs for your Keto Diet?
OKL and Carbohydrate Recommendations
When making the comparison between online and mobile calculators to the OKL chart, it is clear that this is where the chart really shines through as the more viable and effective option.
To remain in ketosis, you must have a certain restriction on your carbohydrate levels.
This has been clearly outlined by Raymund Edwards in his chart, however the other calculator tools may exceed the amount of daily carbohydrate required to remain in ketosis (if the individual is consuming relatively high calories).
The chart also distinguishes between total and “net” carbohydrate (net being total carbohydrate minus fibre in this instance), something the calculators frequently miss on.
Unlike protein, where the target is set as “EAT AT LEAST”, carbohydrate targets are defined as “NO MORE THAN”, highlighting that intake of carbohydrate can only decrease rather than increase (to better manage blood glucose) if the recommendations from the chart are employed correctly.
Read Also: What are the Best Keto Meters for Weight Loss?
OKL and Dietary Fat Recommendations
This is the only macronutrient in the chart that provides us with a range to choose from. Essentially this is a guide for where to aim for with your dietary intake dependent on your weight-based goal at that time.
The lower range of fat intake is based on a calorie deficit, the upper range is therefore based on a calorie surplus; one side for weight loss, the other for weight gain and somewhere in between, weight management/maintenance.
This is where the chart could do a little better however and highlight exactly which kind of dietary fats and of how much, keto dieters should be aiming for (especially for those in a surplus).
Research has shown that a greater ratio of saturated and trans fats to monounsaturated and polyunsaturated fats can lead to greater accrual of liver and belly fat resulting in worsened body composition and health markers.
So, although keto is a high fat diet, that doesn’t take away from the fact that we should still be conscious of making the more nutritious choice in most cases (if our goal is to be in a state of optimal ketogenic health).
Conclusion
The OKL chart is a stroke of genius by your soon to be best friend Mr. Edwards.
Not only has he effectively and eloquently delivered the findings of many pieces of research but he’s done so in a way that makes them almost universally applicable.
Now, while some may need some more nuanced tweaks to the base recommendations, these still stand as an incredible foundational tool to get started on your ketosis campaign.
Our recommendations would be to aim for a higher protein intake than the minimum recommendations (that 1.4 to 2.2g/kg of bodyweight target is great) and aim to keep your fat sources mainly nutritious (with the odd nicety to keep you sane of course!)
Optimal ketogenic living made easy!